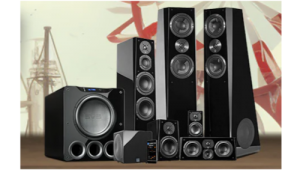
- REVIEWS
Displays Electronics 
Speakers Sources Other Gear Software - HOW TO
How To Buy How To Use Tech 101
Measurements & Meaning: Way Down Deep
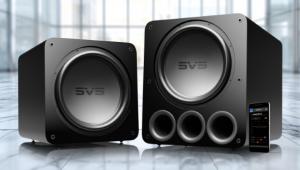
Each of the dozen subwoofers reviewed in this three-part feature was moved outdoors and subjected to a variety of test signals, including pure tones; swept sine waves; shaped tone bursts; pop, orchestral and movie soundtrack selections; and snippets of rumbles, thuds, explosions, crashing waves, bass drum whacks and other recorded sounds. The sub's output was listened to, written up, recorded with instrumentation microphones, post-processed, graphed and analyzed.
Your first question is likely to be, "Why outdoors?" Valid subwoofer tests in any indoor setting, home or lab, present the reviewer with almost insuperable challenges, including the fact that what's being reported on is not the sub, but what that room's "modal landscape" looks like (modes are the frequencies where standing-wave drones occur) and how the sub "couples" to that landscape. The modal landscape is unique to the room (depending primarily on its shape, dimensions, construction, doors, windows and furnishings), and the coupling has to do with where the sub is located within that landscape. Note that neither has much to do with whatever special properties the subwoofer manufacturer may be touting in his brochure. It's not that there are no differences between subwoofers – there are, and we're getting to them – but that the magnitude of difference among good subs is smaller than – swamped out by, really – the difference you'll hear by just moving any particular sub a couple of feet, or moving it to another room entirely. The crippling limitation of conventional in situ testing is that the findings almost never attach specifically and uniquely to the subwoofer in question, nor are the sub/room interactions that dominated the results transportable to other rooms, layouts or other environmental considerations. The combination of these factors creates a profound disconnect between what's being reported and the reader's need for reliable, usable information for a possible purchase decision.
Nearer to Thee?
The simplest and most common workaround is to place the test microphone within an inch or two of the driver itself. The response recorded by this "near-field" technique will be disproportionately weighted to favor the driver's direct contribution over the room's, which would seem to solve the problem. A few challenges remain, however: When that close, mics tend to overload at the higher playback levels; any port or passive radiator must be separately recorded and its response spliced together with the driver's, typically by eye; there's no simple way to peg the playback level to some standard (say, 100dB at 1 meter) because the inverse-square law doesn't hold sway that close to the driver; and, knottiest of all, the fact that you can shove a mic right up to a driver, but you can't listen there, so you're right back where you started.
Open and Shut?
The other technique requires more work and some specialized equipment. A "time-smart" analyzer can cut through the morass of room sound to "hear" just the main speaker (though not in the bass, as we'll see). Think of such a thing as a sound analyzer with a camera shutter fitted to it: It sends out a signal, waits for the sound to travel through the air to the mic, snaps opens its shutter to let it in, then slams shut before the first reflected sounds arrive. (Those response-scrambling reflections, after all, have to bounce off something first, meaning they travel longer paths than the direct sound and hence arrive a little later.)
This open-then-shut technique – and we're speaking a little metaphorically here – is called "time windowing" and it works magnificently, provided there's a little temporal gap between the last of the direct sound and the start of the initial reflections.
But this is not the case in the bass, because the shutter has to be open at least long enough to "see" a single cycle of the frequency of interest. In the case of, say, a 20Hz note, that's 1/20th of a second, or 50 milliseconds. Since sound travels roughly a foot per millisecond, that means that during its 50 millisecond minimum "on" time, the mic will be open to receiving reflections off walls, floor, ceiling and most any other large object that can offer a path from sub to mic that is up to 50 feet longer than the direct sub-to-mic distance. If you do the numbers, you'll see that avoiding substantial room contamination at the lowest frequencies would require putting the sub on the floor in the middle of a room that's at least 50 feet by 50 feet by 25 feet high.
For decades, the solution has been obvious: Move the entire test system – subs, mics, analyzers, oscilloscope, listening chair – outdoors, fifty or a hundred feet or more from any object large enough to reflect the test signals back toward the mic or listener. Ask a subwoofer engineer what his ideal test "venue" is and he'll almost certainly say a big, empty field or parking lot with utility services, far from noise sources. My setting in the middle of an undeveloped 40-acre ranch in the Sierra foothills makes for a nearly ideal plein air lab about 8 months of the year, and has the advantage of being near my little swimming hole.
Hardware
My primary test platform was the Techron/Gold Line TEF20SHIP running Gold Line's Sound Lab software suite under Windows XP on a Dell laptop PC. Through a windowing technique known as Time Delay Spectrometry, the TEF sent a swept sine wave to the subwoofer and applied a tracking filter to the mic input, delayed to account for the sound's transit time to the mic. This had the effect of making the TEF "listen" for only a specific frequency at a specific point in time, rendering it "deaf" to all other sounds. The only objects large enough to reflect bass's long wavelengths back toward the mic were so far away that the reflections, as faint as they were, reached the mic well after its "shutter" had slammed shut. The integrity of the test data remained extraordinarily high even if, during the time the mic was "open," a bird chirped, a distant horn honked, or a plane flew overhead, because at that moment, the TEF wasn't "listening" for that specific frequency.
Not having to worry about reflections or noise contamination enabled me to draw the sweeps out to 35 seconds to get the best frequency resolution (2Hz). Each sweep was sampled at 2,048 separate data points between 15 and 150Hz, i.e., the TEF recorded separate pairs of magnitude and phase values at a frequency spacing of about every 0.07Hz.
Getting Ready
When its turn arrived, I carted each sub from its sheltered location out to the test area, set it on the ground, removed its grille if it had one, made the connections, and adjusted its controls, if so equipped, to run "raw" (that is, with either the crossover switched out or set to its highest setting, typically >100Hz). If its electronics included an onboard equalizer to address room acoustics problems, I functionally bypassed it. Configuring each sub to operate in its "widest and flattest" mode was a prerequisite for exploring its native abilities and limits.
To get it "limbered up" I fed it pink noise and some practice TEF sweeps. I then ran a background noise test and an Energy-Time Curve sweep to verify there was nothing in the environment contaminating the measurements.
Frequency Response
For the frequency response measurements, I laid a freshly calibrated Crown CM150 instrumentation microphone on the ground 2 meters from the sub's acoustic center. This provided enough distance for the active driver to integrate with the output of the port or passive bass radiator if it had one. (If the sub had a port or PBR on the back, the sub was rotated so both were equidistant to the mic.)
I adjusted the TEF's output and the sub amplifier's gain control so that a 45-50Hz signal produced 74 decibels at the 2 meter mic location, the direct equivalent of 80dB at 1 meter. (In open space, sound from a spherical radiator drops 6dB each time you double the distance from the source. I added back in the 6dB to each trace during the post-processing phase.) I selected the 45-50Hz frequency range because it was "real bass" but would be relatively easy for every sub in the survey to reproduce. To get the 90, 100, 105, 110 and 115dB/1m curves, I programmed 10, 20, 25, 30 or 35dB voltage increases, respectively, from the keyboard and re-ran the sweeps.
Note that driving a subwoofer 10dB harder at its input won't always produce 10dB more sound output. The point of increasing the drive level was to show at what frequency ranges and playback levels the sub started to run out of gas. The effect, known as "power compression," can be inferred from the frequency response traces, typically where the uppermost traces bunch closer to the ones below them, especially at the far left end (deep bass range).
For an example, refer to Fig.1 on page 70 of the June issue of UAV. A "perfect" subwoofer would not change frequency response with changes in overall level: All five traces would have the identical shape, offset exactly 5 or 10 decibels from each other vertically. The gray section in the lower left corner represents sound levels that are too soft to hear.
Power Compression
Although implied in the previously mentioned frequency response traces, a sub's ability to track dynamics can be seen directly in the separate power compression graphs. The 100, 105, 110 and 115dB traces (shown dark green, lime green, orange and red, respectively) are normalized to the 90dB/1m baseline response, with the incremental voltage drive (10, 15, 20 or 25dB) subtracted. Ideally, all four traces would be flat, straight lines at 0dB, indicating that response at every playback level was a carbon copy of the 90dB baseline response, just louder by an amount that corresponded exactly to the increased voltage applied to the sub's input terminals. In the real world, protection circuits kick in to limit distortion and prevent driver overexcursion, and heat builds up in and around the voice coil, changing its resistance and therefore its responsiveness. All things being equal, a sub with 0dB compression across its range up to 110 decibels or more at 1 meter would likely foster a more "you-are-there" experience than one that softened or compressed the program's dynamic contours. Note that because the curves are normalized to the 90dB trace, the graph is able to isolate how well the sub replicated level changes: By design, its frequency response is neither shown nor even knowable without reference to the frequency response graph.
Power compression is the audio equivalent of getting shortchanged. The orange trace in Fig.2 (UAV June 2004, page 70) shows the sub losing – burning up as heat – about 7.5dB of the 20dB added to the 90dB baseline at 20Hz, though the response holds up well at this 110dB level down to 30Hz. The rapid loss of sub-30Hz energy would be heard as the bass losing its impact and low-end wallop as the volume was turned up. Ideally, all four traces would be flat lines at 0.
Harmonic Distortion
I measured Total Harmonic Distortion (THD) at the eight standard one-third octave centers from 20-100Hz using the TEF and its companion SLX software. The system sends the sub a reference sine wave signal at the test frequency, e.g., 31Hz, and looks for the presence of energy at integer multiples (e.g., 62, 93, 124Hz and so on). To reduce the already minor effect of background noise on the measurement, I set the CM150 microphone on axis 8 to 20 inches (0.2-0.5m) from the driver and repeated the tests 4 to 8 times, spread over different days; each of the vertical THD bars represents the lowest value recorded.
Note that the THD bars are arrayed left to right by frequency, and front to back by playback level in 5dB increments, with the highest level (115dB/1 meter) in the back, and lowest (95dB/1m) in the front. This provides a picture of how distortion changed as the sub got pushed harder.
Max Level
To determine maximum peak levels before distortion, I fed each sub a sequence of shaped tone bursts on standard one-third octave centers. Produced by Siegfried Linkwitz, such "boinker" signals exercise drivers to their limits, but are so short that they neither sound very loud to humans (to sense something at its full loudness, our hearing needs sound to last many times the burst's short duration), nor have a chance to create a thermal problem for the driver's voice coil. The distortion components, on the other hand, are plainly audible. For the technically curious, the signal is created by multiplying a continuous sine wave with a raised-cosine envelope. The number of cycles is constant at five, with the window time length decreasing with increasing frequency to hold the spectrum width to a constant percentage of the center frequency. See Linkwitz in the References section.
On the receive side, a Brüel & Kjær 2260 Investigator precision sound-level meter was positioned so that its calibrated mic was 1 meter from the sub driver. I sat 48 inches from the sub, adjusted the drive level to just short of the point where audible distortion began, and logged the maximum peak level as recorded by the B&K in its fast-responding, linear (non-weighted) mode. A feed from the 2260's aux out to the input of a Tektronix HDS644A oscilloscope let me monitor the waveform I was hearing. I typically reran the full set of max level tests on each sub 5 or more times on different days to arrive at a final peak level for each of 7 test frequencies from 20 to 80Hz.
Waterfall Displays
Technically referred to as spectrograms (as on pages 72 and 73, UAV June 2004), these colorful graphs provides a picture of how deep and loud a subwoofer managed to play a particularly treacherous 10-15 second clip from a soundtrack or CD. I disconnected the main speakers and turned up the subwoofer level to a point just 1 decibel before the onset of audible distortion, then recorded it with the CM150 microphone placed 2 meters away. The graphs were made by routing the mic's output to a Sound Devices USBPre, an external 24-bit, 96kHz A-D converter that passed its output to the laptop PC via a USB cable (thereby bypassing the laptop's internal sound card).
Background Noise
I used both the B&K and TEF to record background noise levels (only one shown here for space reasons) during each subwoofer's test period to verify that such noise was far enough below the signal level to make the frequency response traces accurate to within a small fraction of a single decibel.
Listening Tests
For the listening tests I rounded up bass-challenging selections from current CDs and DVDs and fed my Sony DVD player's digital out to a Lexicon MC12B surround processor, whose main left and right outputs drove a pair of active, 3-way studio control room monitors (Genelec 1037s). I selected the 1037s for their flat response; low distortion; the fact that their output capabilities handily exceeded that of almost all subwoofers; and their inclusion of an "Overload" light to alert me if the speaker or its power amps ever "hit the wall," thus minimizing the possibility of attributing main speaker break-up to the subwoofer. The speakers were elevated so as to place the tweeter on axis with my ears, and arranged laterally to subtend a 60° angle at the listening position 8 feet away. The subwoofer was placed on the ground between and slightly behind the left and right mains so that all three were 2 meters from the mic location about 18 inches in front of the "money seat" (if it's possible to call a humble lawn chair by that name). The subwoofer under test received its signal from the Lexicon by way of either unbalanced, RCA-tipped Straightwire interconnects, or balanced, XLR-tipped quad-shielded Canare cable.
My listening preferences in the bass can be summarized by stating what I especially don't like: 1.) A turgid, soggy or boxy mid-bass (typical cause: non-flat spectral balance); 2.) Buzz, fuzz, hum, hash, sizzle, rattle, squeak, whoosh, boom, chuff, thwock or other onomatopoeic addition to the recorded signal, from any of the sub's parts – driver, port, cabinet, feet, grille or electronics module (typical cause: additive distortions); 3.) A sense that certain bass sounds lack their natural deep-bass underpinnings, robbing the presentation of a sense of physicality or rootedness (typical cause: lack of extension to an honest 20Hz at realistic playback levels); 4.) A blunted or washed-out treatment of the sound's expected dynamic swings (typical cause: protective limiting circuits and/or power compression).
I set both high- and low-pass sections of the Lexicon's crossover at "80Hz THX" and configured the subwoofer outputs for mono mode. I used the Brüel & Kjær sound-level meter and standard test tones – 80Hz warble tones from the Low Frequency Optimizer CD (included with the Revel B15 subwoofer) and/or 80Hz band-limited pink noise from the PMI/Gold Line 5.1 Audio Toolkit DVD – to set the subwoofer's phase switch for flat response in the crossover region. With the crossover and phase settings in place, I used the Lexicon's built-in noise generator to adjust the left, right and subwoofer output trim levels to read 80dB +/-0.3 at the 2 meter mic location. Note that this is 5dB "hotter" than the usual 75dB, which gave me more maximum output level.
Each sub was evaluated with the following core selections, played in order:
• "Jurassic Lunch," Erich Kunzel, Cincinatti Pops Orchestra, The Great Fantasy Adventure Album, Telarc CD-80342 (CD).
• U-571, widescreen collector's edition, Universal 20785 (DVD).
• Pearl Harbor, 60th anniversary commemorative edition, Touchstone Pictures 23889 (DVD).
• Black Hawk Down, Columbia 06766 (DVD).
• Casper: Music from the Motion Picture Soundtrack, MCA Soundtracks MCAD-11240 (CD).
• Apocalypse Now Redux, widescreen collection, Paramount 09629 (DVD).
• Blue Crush, collector's edition, Universal 22132 (DVD).
• The Matrix, Warner Bros. 17737 (DVD).
• Star Wars Episode 1: The Phantom Menace, Lucasfilm (DVD).
• Peter Ilyich Tchaikovsky: 1812 Overture, op. 49, Erich Kunzel, Cincinatti Symphony Orchestra, Telarc DVDA-70541 (DVD-A).
• Gustav Holst: "March" from First Suite, Frederick Fennell, Cleveland Symphonic Winds, Telarc CD-80038 (CD).
• Bela Fleck: "Flight of the Cosmic Hippo" from Flight of the Cosmic Hippo, Warner Bros. 26562-2 (CD).
I frequently followed up the core selections with one or more of the following supplemental tracks, in no particular order: live concerts on DVD by The Eagles (Hell Freezes Over), Alison Kraus + Union Station (Live), The Band (The Last Waltz), Moody Blues (Live: Hall of Fame), and Peter Gabriel (Secret World Live). My supplemental CD tracks included "Jersey Girl" from Holly Cole's Temptation, "Breaking Silence" from Janis Ian's album of the same name, "When the Cat Turns Blue" from Rusted Root's When I Woke, "Fun House" from Flim & the BBs' Big Notes, Albinoni's Adagio (Gary Karr, contrabass), Mahler's Fifth Symphony (Telarc DVD-A), Rachmaninoff Symphonic Dances (Reference Recordings HDCD), and Stravinsky's Rite of Spring (Reference Recordings HDCD). Finally, sometimes late at night I'd just go out and listen to music that I felt like hearing – often early Baroque music played by one of Jordi Savall's ensembles – without concern for its use as a "bass demo."
Program Peak Levels and Spectrum
During the listening sessions involving the Holst, "Jurassic Lunch," Matrix and Phantom Menace selections, I disconnected the main speakers and adjusted subwoofer playback volume until reaching the point at which distortion became audible. I captured the peak level (fast response, C weighting) and the spectrum of each track on the B&K SLM.
References and Further Reading
In addition to these subwoofer-related titles, I've prepared listings and capsule summaries of many books and articles on audio and room acoustics at www.keithyates.com/resource.htm.
• Atkinson, John: "Measuring Loudspeakers, Parts 1, 2 and 3" Stereophile, November 1998, December 1998 and January 1999.
• Bech, Søren: "Requirements for Low Frequency Sound Reproduction, Part I," Journal of the Audio Engineering Society, vol. 50, no. 7/8, July/Aug. 2002.
• Bech, Søren: "Quantification of Subwoofer Requirements, Part II: The Influence of Lower System Cut-Off Frequency and Slope and Pass-Band Amplitude and Group Delay Ripple," 109th Convention of the Audio Engineering Society, Los Angeles, September 2000.
• Borenius, Juhani: "Perceptibility of Direction and Time Delay Errors in Subwoofer Reproduction," Preprint 2290, 79th Convention of the Audio Engineering Society, New York, October 1985.
• Borwick, John, editor: Loudspeaker and Headphone Handbook, Focal Press, 1994.
• Bücklein, R.: "The Audibility of Frequency Response Irregularities," Journal of the Audio Engineering Society, vol. 29, March 1981.
• D'Appolito, Joseph: Testing Loudspeakers, Audio Amateur, 1998.
• Everest, F. Alton: The Master Handbook of Acoustics, McGraw-Hill, 2001.
• Fielder, Louis and Benjamin, Eric: "Subwoofer Performance for the Accurate Reproduction of Music," Journal of the Audio Engineering Society, vol. 36, June 1988.
• Fincham, Laurie: "The Subjective Importance of Uniform Group Delay at Low Frequencies," Preprint 2056, 74th Convention of the Audio Engineering Society, New York, October 1983.
• Gelfand, Stanley: Hearing: An Introduction to Psychological and Physiological Acoustics, 3rd ed., Marcel Dekker, 1998.
• Howard, David and Angus, James: Acoustics and Psychoacoustics, 2nd edition, Focal Press, 2001.
• Kügler, Christoph and Theile, Günter: "Loudspeaker Reproduction: Study on the Subwoofer Concept," Preprint 3335, 92nd Convention of the Audio Engineering Society, Vienna, March 1992.
• Kuttruff, Heinrich: Room Acoustics, 4th ed., Spon Press, 2000.
• Linkwitz, Siegfried: "Shaped Tone-Burst Testing," Journal of the Audio Engineering Society, vol. 28, no. 4, April 1980.
• Lipshitz, Stanley, Heal, Michael and Vanderkooy, John: "An Investigation of Sound Radiation by Loudspeakers Cabinets," Preprint 3074, 90th Convention of the Audio Engineering Society, Paris, February 1991.
• Nousaine, Tom: "Multiple Subwoofers for Home Theater," Preprint 4558, 103rd Convention of the Audio Engineering Society, New York, September 1997.
• Pedersen, Jan, Hermansen, Kjeld and Rubak, Per: "The Distribution of the Low-Frequency Sound Field and its Relation to Room Equalization," Preprint 3852, 96th Convention of the Audio Engineering Society, Amsterdam, February 1994.
• Prohs, John, editor: Time Delay Spectrometry, Audio Engineering Society, New York.
• Salava, Tomas: "Subwoofers in Small Listening Rooms," Preprint 4940, 106th Convention of the Audio Engineering Society, Munich, May 1999.
• Olive, Sean et al.: "Perception of Reproduced Sounds in Rooms: Some Results from the Athena Project," Proceedings of the 12th International Conference, Audio Engineering Society, June 1993.
• Toole, Floyd: Loudspeakers and Rooms for Multichannel Audio Reproduction, Harman International website, www.harman.com, 2002.
• Warren, Richard M.: Auditory Perception, Cambridge University Press, 1999.
• Welti, Todd: "How Many Subwoofers are Enough?" Preprint 5602, 112th Convention of the Audio Engineering Society, Munich, May 2002.
• Gander, Mark: "Dynamic Linearity and Power Compression in Moving-Coil Loudspeakers," Journal of the Audio Engineering Society, vol. 34, no. 9, September 1986.
• Gander, Mark: "Ground-Plane Acoustic Measurement of Loudspeaker Systems," Journal of the Audio Engineering Society, vol. 30, no. 10, October 1982.
• Buser, Piere and Imbert, Michel: Audition, Bradford/MIT Press, 1992.
Acknowledgments
Many people helped me over the months of testing. I'd especially like to thank Siegfried Linkwitz for generously giving of his time and insights; Lexicon for extended use of the surround processor; Greg Miller at Gold Line and Lance Presnall at Brüel & Kjær for hardware assistance; Parasound and Lab.Gruppen for the power amps; Rick Riley for writing the custom data processing routines that saved hours of work after the measurements were finished; Paul Warenycia and Richard Humphrey for help with the oscilloscope; Patrick Calderone, Kevin Larsen and Travis Chambers for moving it all around; Dave Barber for photographing it; Raj of my staff for help with the graphs; and my wife, Hanne, for sacrificing her vacation.


| Displays Electronics Speakers | Sources Other Gear Software | Top Picks of the Year Top Picks | Custom Install How To Buy How To Use |
Tech 101
|
Latest News Features Blogs | Resources Subscriptions |
WHERE TECHNOLOGY BECOMES ENTERTAINMENT
 © 2025 Sound&Vision
AVTech Media Americas Inc., USA
All rights reserved

