Polk Audio RTi A Series Home Theater Speaker System Page 3
TEST BENCH By Tom Nousaine
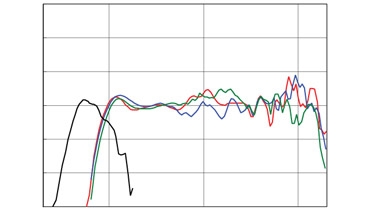
Key to Above Graph: • L/R 80 Hz to 16.7 kHz ±4.0 dB • Center 83 Hz to 17.2 kHz ±3.8 dB • Surround 88 Hz to 16.3 kHz ±2.9 dB • Subwoofer 40 Hz to 105 Hz ±2.0 dB
Frequency response (at 2 meters) front left/right: 80 Hz to 16.7 kHz ±4.0 dB center: 83 Hz to 17.2 kHz ±3.8 dB surround (bipole): 87 Hz to 16.5 kHz ±3.9 dB surround (dipole): 88 Hz to 16.3 kHz ±2.9 dB subwoofer (Corner mode): 40 Hz to 105 Hz ±2.0 dB
Sensitivity (SPL at 1 meter with 2.8 volts of pink-noise input) front left/right: 89 dB center: 89 dB surround (bipole): 88 dB surround (dipole): 87 dB
Impedance (minimum/nominal) front left/right: 4.0 / 6 ohms center: 4.1 / 5 ohms surround: 3.1 / 4 ohms
Bass limits (lowest frequency and maximum SPL with limit of 10% distortion at 2 meters in a large room) front left/right: 80 Hz at 86 dB center: 80 Hz at 88 dB surround (bipole): 80 Hz at 86 dB surround (dipole): 80 Hz at 84 dB subwoofer: 25 Hz at 81 dB SPL 99 dB average SPL from 25 to 62 Hz 107 dB maximum SPL at 62 Hz bandwidth uniformity: 93%
All the curves in the frequency-response graph are weighted to reflect how sound arrives at a listener's ears with normal speaker placement. The curve for the front left/right channels reflects response of the RTi A3 averaged over a ±30° window. The center-channel curve reflects response of the CSi A4 averaged over ±45°, with double weight directly on-axis of the primary listener. The surround-channel curve shows the response of the FXi A4 averaged over ±60°.
All satellite speakers were measured on a 6-foot stand, which gives anechoic results to approximately 200 Hz. All upper-channel measurements were taken at a full 2 meters, which emulates a typical listening distance, allows larger speakers to fully integrate acoustically, and (unlike near-field measurements) fully includes front-panel reflections and cabinet diffraction.
L/R, Center, and Surrounds
Polk Audio's RTi A3 displayed a 2-dB rise from 700 to 1,100 Hz and considerable peakiness above 3 kHz, but its directivity was tightly controlled. The CSi A4 center channel has fairly severe off-axis lobing at listening angles greater than ±22°. The FXi A4 surround's average response looks similar to that of the CSi A4, but its trace doesn't fully show the differences in response when measured at various radiating angles. For example, when measured directly on axis in bipole mode, response was +5 dB between 1.5 and 3 kHz with up to 15 dB less output above 8 kHz as compared to the dipole mode (shown in graph).
Subwoofer
The DSW Pro 500 subwoofer's bass limits were measured with the sub set to maximum bandwidth and placed in the optimal corner of a 7,500-cubic-foot room. In a smaller room, users can expect 2- to 3-Hz deeper extension and up to 3-dB higher sound-pressure level (SPL). Basic measurements were taken with the subwoofer in the Corner operating mode, but the EQ changes in the other modes are easily described in the text.
Measurements of the DSW Pro 500 subwoofer reveal a moderate dynamic capability. The Cabinet mode increases response below 60 Hz by 3 dB, while Mid-Wall increases output by roughly 1.6 dB over the same operating range. The Mid-Room mode raises output below 100 Hz by 1.5 dB, with a gradual increase to +7 dB by 25 Hz. The actual response of the sub's crossover runs from 60 to 105 Hz (the specifications state 60 to 120 Hz), and there is only a small volume/crossover interaction.


