Fujitsu Plasmavision P65FT00AUB Plasma HDTV HT Labs Measures


The top chart is the P65FT00AB's color primaries and secondaries (colored circles and white triangle) as seen on a CIE 1976 chromaticity diagram versus the SMTPE-specified standards (colored diamonds and gray triangle). The converted x,y coordinates (for comparison to a CIE 1931 chart) are Red: x=0.648, y=0.338, Green: x=0.276, y=0.651, and Blue: x=0.152, y=0.064.
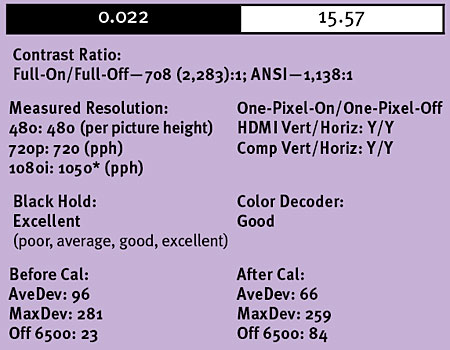
The middle chart shows the P65FT00AB's gray-scale tracking, as in its color temperature (vertical axis) versus its brightness (horizontal axis). The left-most point is an IRE of 20, a dark gray. The right-most point is an IRE of 100, a bright white. The dotted line represents the ideal target of D65, or 6504K. The gray scale as set by the factory, in the 3000 color-temperature mode and the Natural picture mode, measures quite well (blue trace). After making adjustments using the Photo Research PR-650, the gray scale measures a little better (red trace). The P65FT00AB's gray-scale tracking before calibration is good, so it has an AveDev of 96. It has some variations, so it has a MaxDev of 281. Its entire gray scale averages 23K off 6500K. After calibration, this is slightly improved, except for being slightly further from 6500.
After calibration, and using a full-field 100-IRE white (15.57 foot-lamberts) and a full-field 0-IRE black (0.022 ft-L), the contrast ratio was 708:1. Using a 16-box checkerboard pattern (ANSI contrast), the contrast ratio was 1,138:1. The P65FT00AB produces 50.23 ft-L on a 100-IRE window for a real-world contrast ratio of 2,283:1. (It is normal for a plasma to have lower light output on a full-white field versus a white window.) *Because this display was capable of resolving a One-Pixel-On/One-Pixel-Off pattern, this resolution measurement is likely a processing quirk or measurement anomaly.—GM
- Log in or register to post comments


