Home Entertainment’s Unexpected Evolution

For most Americans, the disjointed nature of home entertainment today — the inability to get all or most of the movies and programs you’re interested in from one provider at a fair price — is maddening. But it’s nothing new. Before streaming, cable companies forced customers to choose among fixed bundles instead of letting them choose the channels they actually wanted to watch, which meant you had to settle for less or take on a second mortgage to pay for the “premium package” and even then sift through dozens of channels you couldn’t care less about to get to the ones you wanted. (The same holds true among today’s ever-shrinking pool of cable subscribers, which helps explain why 1.8 million households dropped cable and satellite “pay-TV” subscriptions during the first three months of the year (Kagan) — an all-time high spurred in part by the unprecedented loss of jobs due to the coronavirus pandemic.) Even in the age of streaming, where we have more choices than ever before, there’s no silver bullet — we still have to pick and choose among an ever expanding list of providers and supplement that with what we can find on Blu-ray, ideally 4K with high dynamic range and Dolby Atmos sound.
The recently released Video Trends Report, an annual study commissioned by TiVo, found more than a third (36%) of pay-TV subscribers also subscribe to Netflix and YouTube with Amazon Prime Video replacing YouTube for 27% of the survey’s 4,367 respondents (Americans and Canadians over 18). The most popular mix among “broadband-only” streaming subscribers found a quarter of them paying for Netflix, Prime Video, and YouTube with Hulu or Disney+ replacing YouTube for 16% of survey participants. You can see the full breakdown in the chart below.
How much are people spending? As of the end of March, pay-TV households were shelling out $129 a month on average — three times more than the $44 a month streaming-only households were paying. And a majority of viewers from both camps (65% and 71%, respectively) said they were satisfied with the video services they signed up for. Even so, 11% reported canceling their pay-TV service in the last six months and 13% say they plan to cut the cord in the next six months.
This is what the industry calls “churn,” and it’s not unique to pay TV. One in 10 (11%) of those who subscribe only to streaming services reported canceling a subscription streaming service within the last six months. And during the same time frame, 22% of pay-TV subscribers said they cancelled a streaming service, with more than half of the respondents in each camp citing expense as the top reason for doing so.

Getting back to the frustration of not being able to easily get all the content we want, an overwhelming majority of Americans and Canadians (84%) confirmed that they like the idea of being able to view, browse, and search content from all available sources — including broadcast TV and paid streaming services — through a single, unified interface instead of wasting time navigating multiple apps and sources. More to the point, three quarters (77%) said they are willing to pay for such a service.
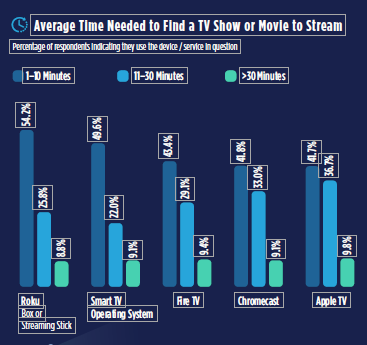
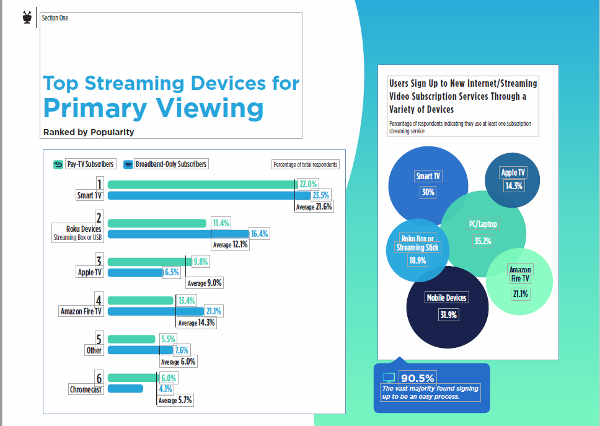
A big part of the frustration is the time it takes to find a movie or TV show to stream. A quarter (26%) of those who use the popular Roku streaming platform said it takes them as long as a half an hour to find the right program, while more than half (54%) reported spending 1 to 10 minutes searching. (I have to assume Roku’s user interface, which I find to be clunky, is at least partly responsible for these delays but I digress...) For viewers who rely on pre-loaded apps on smart TVs — the most popular platform for primary viewing among survey participants — close to a quarter (22%) reported spending 11 to 30 minutes searching for content, while half said they spend 1 to 10 minutes. Sound familiar? The chart below includes stats for the most popular streaming platforms.
Discovering New Content
These findings go hand in hand with our desire to discover new movies and shows to watch amid a mountain of choices, which appeared endless until the pandemic shut down TV and movie production. Most viewers find new content from commercials (55%) and word-of-mouth suggestions (49%), while a third point to social media as key a source of discovery.
Viewers are also becoming more aware of personalized recommendations from streaming and pay TV services: About 40% of streaming viewers know about (and take advantage of) recommendations, which is up 9% over 2019; awareness among pay-TV viewers is 30%, 5% more than it was in 2019. What’s more, 40% of viewers in both camps said they actually watch recommended programs, while 96% of respondents across the board believe content suggestions are relevant some of the time or all of the time.
Though the public is getting more comfortable with voice search — 7% fewer people see it as a gimmick this year over last year — searching by text is still king for 56% of pay-TV viewers and six out of 10 (63%) streamers, the latter showing an increase of 15% over 2019. These findings go hand in hand with the belief among 86% of pay-TV viewers and 92% of streamers that search results have become more accurate — a boost in confidence of 15% and 22% over 2019.
Local Content Is Key
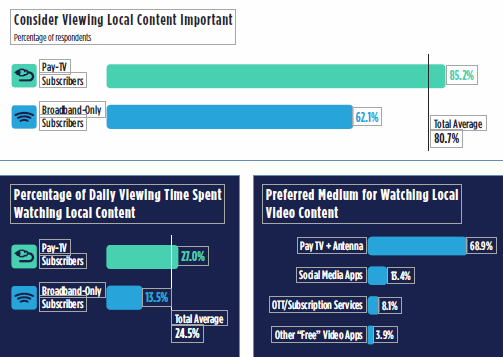
While it’s too early to tell how the COVID-related lockdown will impact consumer behavior over time, early data shows an uptick in live TV viewership as people tune into the news more frequently. At the same time, local content is a big priority for 85% of pay-TV subscribers and 62% of streaming subscribers. Pay-TV subs report spending 27% of their daily viewing time watching local shows, nearly twice as long as those who subscribe to streaming services (14%). Pay TV continues to be the preferred medium for local video content (69%), followed by social media apps, which were a distant second at 13%.
Are You a Precision Viewer?
Organizers of the study wanted to know what we watch but also how we navigate to desired content.
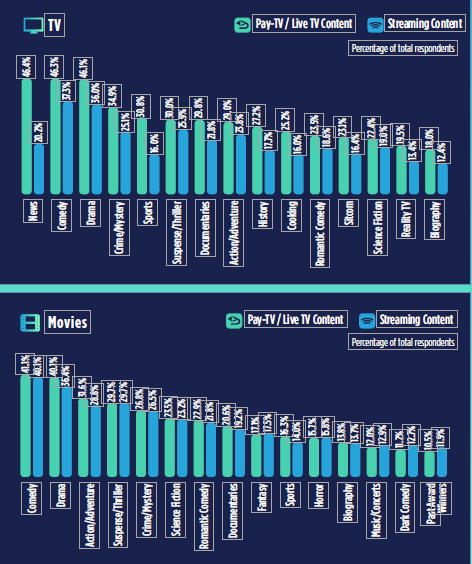
Not surprisingly, the findings show great consistency in preferred movie genres between those who stream and those who watch pay-TV, with comedy, drama, and action/adventure flicks capturing the top three spots. The picture is more varied when it comes to TV shows, with news and sports being more far more important to pay-TV viewers (46% and 30%, respectively) than streaming viewers (20% and 16%, respectively). Of course, when it comes to sports we’re talking mostly classic sports reruns, which TiVo says increased 47% increase among owners of its DVR.
The study also identified three types of viewing behaviors: “surfers” who click through channels, apps or videos to see what catches their fancy; “complementary viewers” who watch videos while multitasking; and “precision viewers” who begin their search with a specific video or show in mind. As you might expect, surfing is most popular among pay-TV subscribers (66%) who click their way across channels. Precision viewing is significant for 48% of survey respondents when it comes to free streaming and 40% with subscription streaming. Complementary viewing is the least common pursuit with pay TV, free streaming, and subscription streaming accounting for only 9%, 15%, and 18%, respectively.
Ads Aren’t So Bad After All
Although TV advertising spawned the famous “commercial skip” button back in the early days of TiVo, this year’s study found that more than half of the viewers surveyed don’t mind commercials — especially when they support free content. If it comes down to a higher price vs. sticking with ads, it seems most people will choose the ads. Just over a quarter (26%) of respondents indicated a willingness to pay more for ad-free content but were overshadowed by those (more than half) who have no interest in paying more to avoid ads — all of which has led to an 11% year-over-year increase in viewer satisfaction with ad-supported streaming services.
Time to Upgrade
Though programming was the focus of the Video Trends Report, the survey didn’t ignore hardware. One in four respondents said they purchased a smart TV in the last six months. Of those, 39% were upgrading to a new smart TV, while 54% were replacing a non-smart TV. Samsung led the pack with a 42% share, followed by LG (17%), Sony (9%), Vizio (8%), and several other brands. Almost a quarter (23%) of respondents say they chose a TV that worked with other devices already in the home, while 20% chose the one that offered the most content options.
What have you learned about your own home entertainment habits in recent months? Have you added or cancelled any services? Bought a new TV? Beefed up your internet connection? Let us know in the Comments section.

- Log in or register to post comments
