Pin Up In casino has become my go-to destination for thrilling entertainment and lucrative rewards! From the moment I registered https://pin-up-win.in/aviator-game/ , I was immersed in a world of excitement and endless possibilities. The selection of games is unparalleled, catering to every mood and preference imaginable. Whether I'm in the mood for fast-paced slots or strategic card games, Pin Up In has it all. What truly sets them apart is their commitment to player satisfaction. The bonuses and promotions are not only generous but also tailored to suit my individual gaming style. The VIP program makes me feel like a valued member of the community, with exclusive perks and rewards that keep me coming back for more. With top-notch security measures in place and reliable customer support available around the clock, I can always play with peace of mind. Pin Up In isn't just a casino; it's a thrilling adventure that never fails to deliver excitement and big wins!
Anatomy of a Speaker Test Report Page 4

Readers with complicated, fast-paced lives might not have the time to get into this section, which also appears in expanded form at soundandvisionmag.com. But if measurements matter to you as much as our subjective take, here's where we'll tell you what's happening.
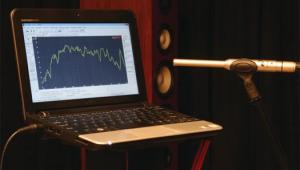
The graph shows frequency-response curves for each speaker type in the system. Audio frequencies ranging from 20 to 20,000 cycles (20 Hz to 20 kHz) get plotted horizontally, while the speaker's loudness (as measured in decibels, or dB) at each frequency is plotted vertically. Rather than being a single, on-axis reading, most curves represent an average of measurements taken over a specific arc (±30º for the front left/right models, ±45º for the center speaker, and ±60º for the surrounds). The measurements are also weighted to accurately reflect how sound arrives at the ears in an average listening room. While it's true that a flat speaker-response curve doesn't necessarily translate into good sound, we do look for an absence of frequency-response "roughness" at specific points in the curve. Such aberrations can easily translate into audible effects like bright or dark colorations, or a dull character when the speakers are listened to off-axis.
Subwoofer measurements are easy to spot in our graph: They're the line that usually takes a deep nosedive around 100 Hz. Two main things we take note of in the condensed magazine version of Test Bench: average output in dB at the low end of the sub's frequency range (62 Hz all the way down to 20 Hz, provided the sub can go that deep) and the frequency at which the sub hits its maximum sound pressure level - 104 dB at 50 Hz, for example.
Bottom Line By the time we get to the Bottom Line, we're ready to pass final judgment. Overall value is a main consideration: How does the system perform compared with other like-priced setups? Does it offer something special for the money, or is it a relative underachiever? Any notable features and performance characteristics are likely to be reiterated here, and to drive the point home they'll show up alongside Plus and Minus bullet points in "The Short Form" box on the first page. (The "Key Features" box directly below the Bottom Line provides important details like cabinet and driver dimensions, weight, and the company's Web address and phone number.) Finally, we'll make it clear whether the system gets the prestigious Sound & Vision Certified and Recommended stamp - something you'll see overlaid on the product photo on the opening page.
- Log in or register to post comments


